Easy and Fast Reporting
with Power BI Reports Pack
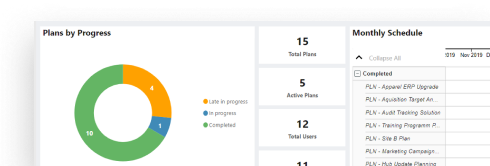
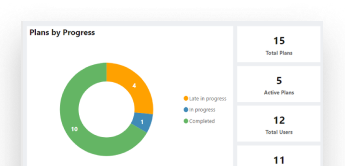
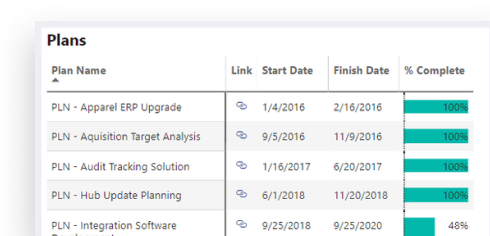
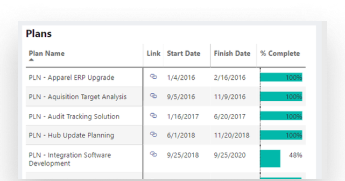
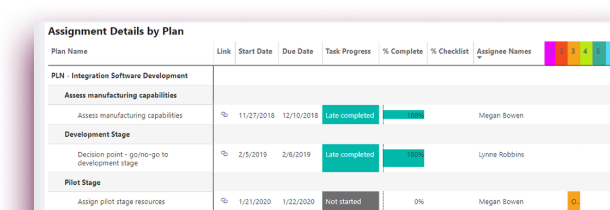
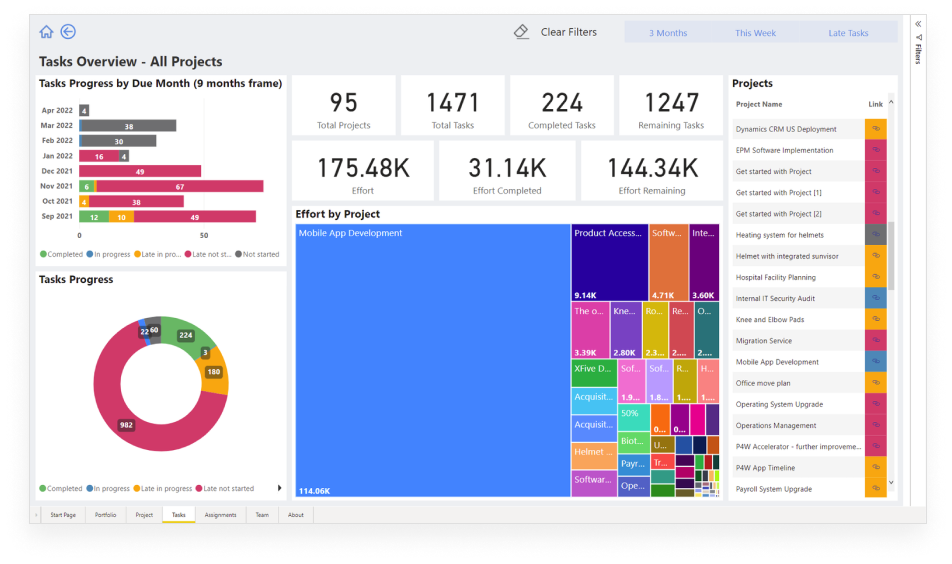
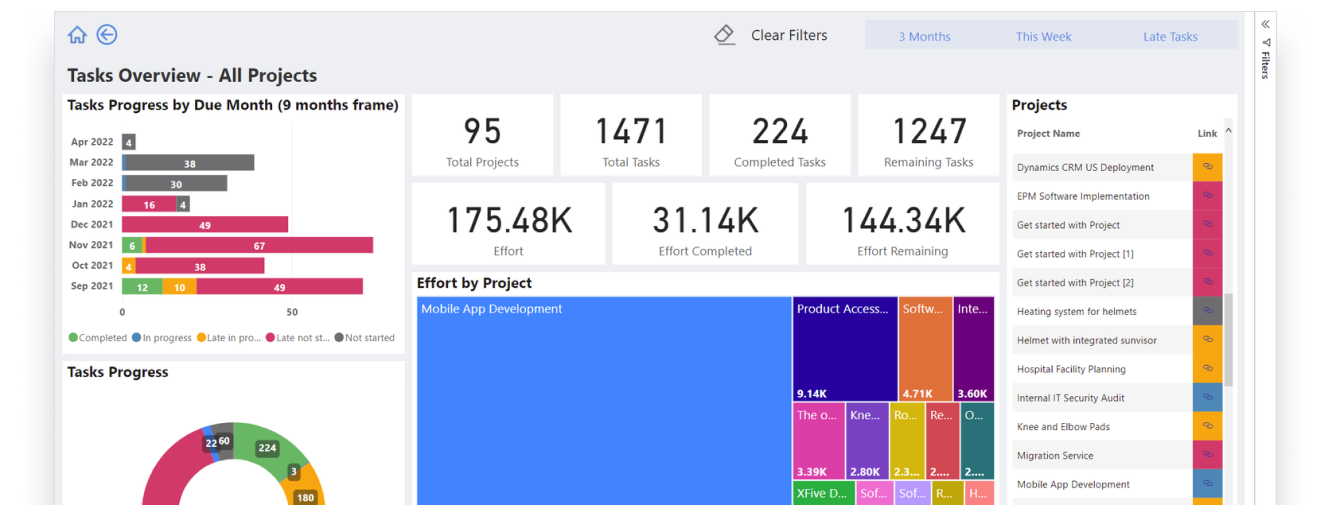
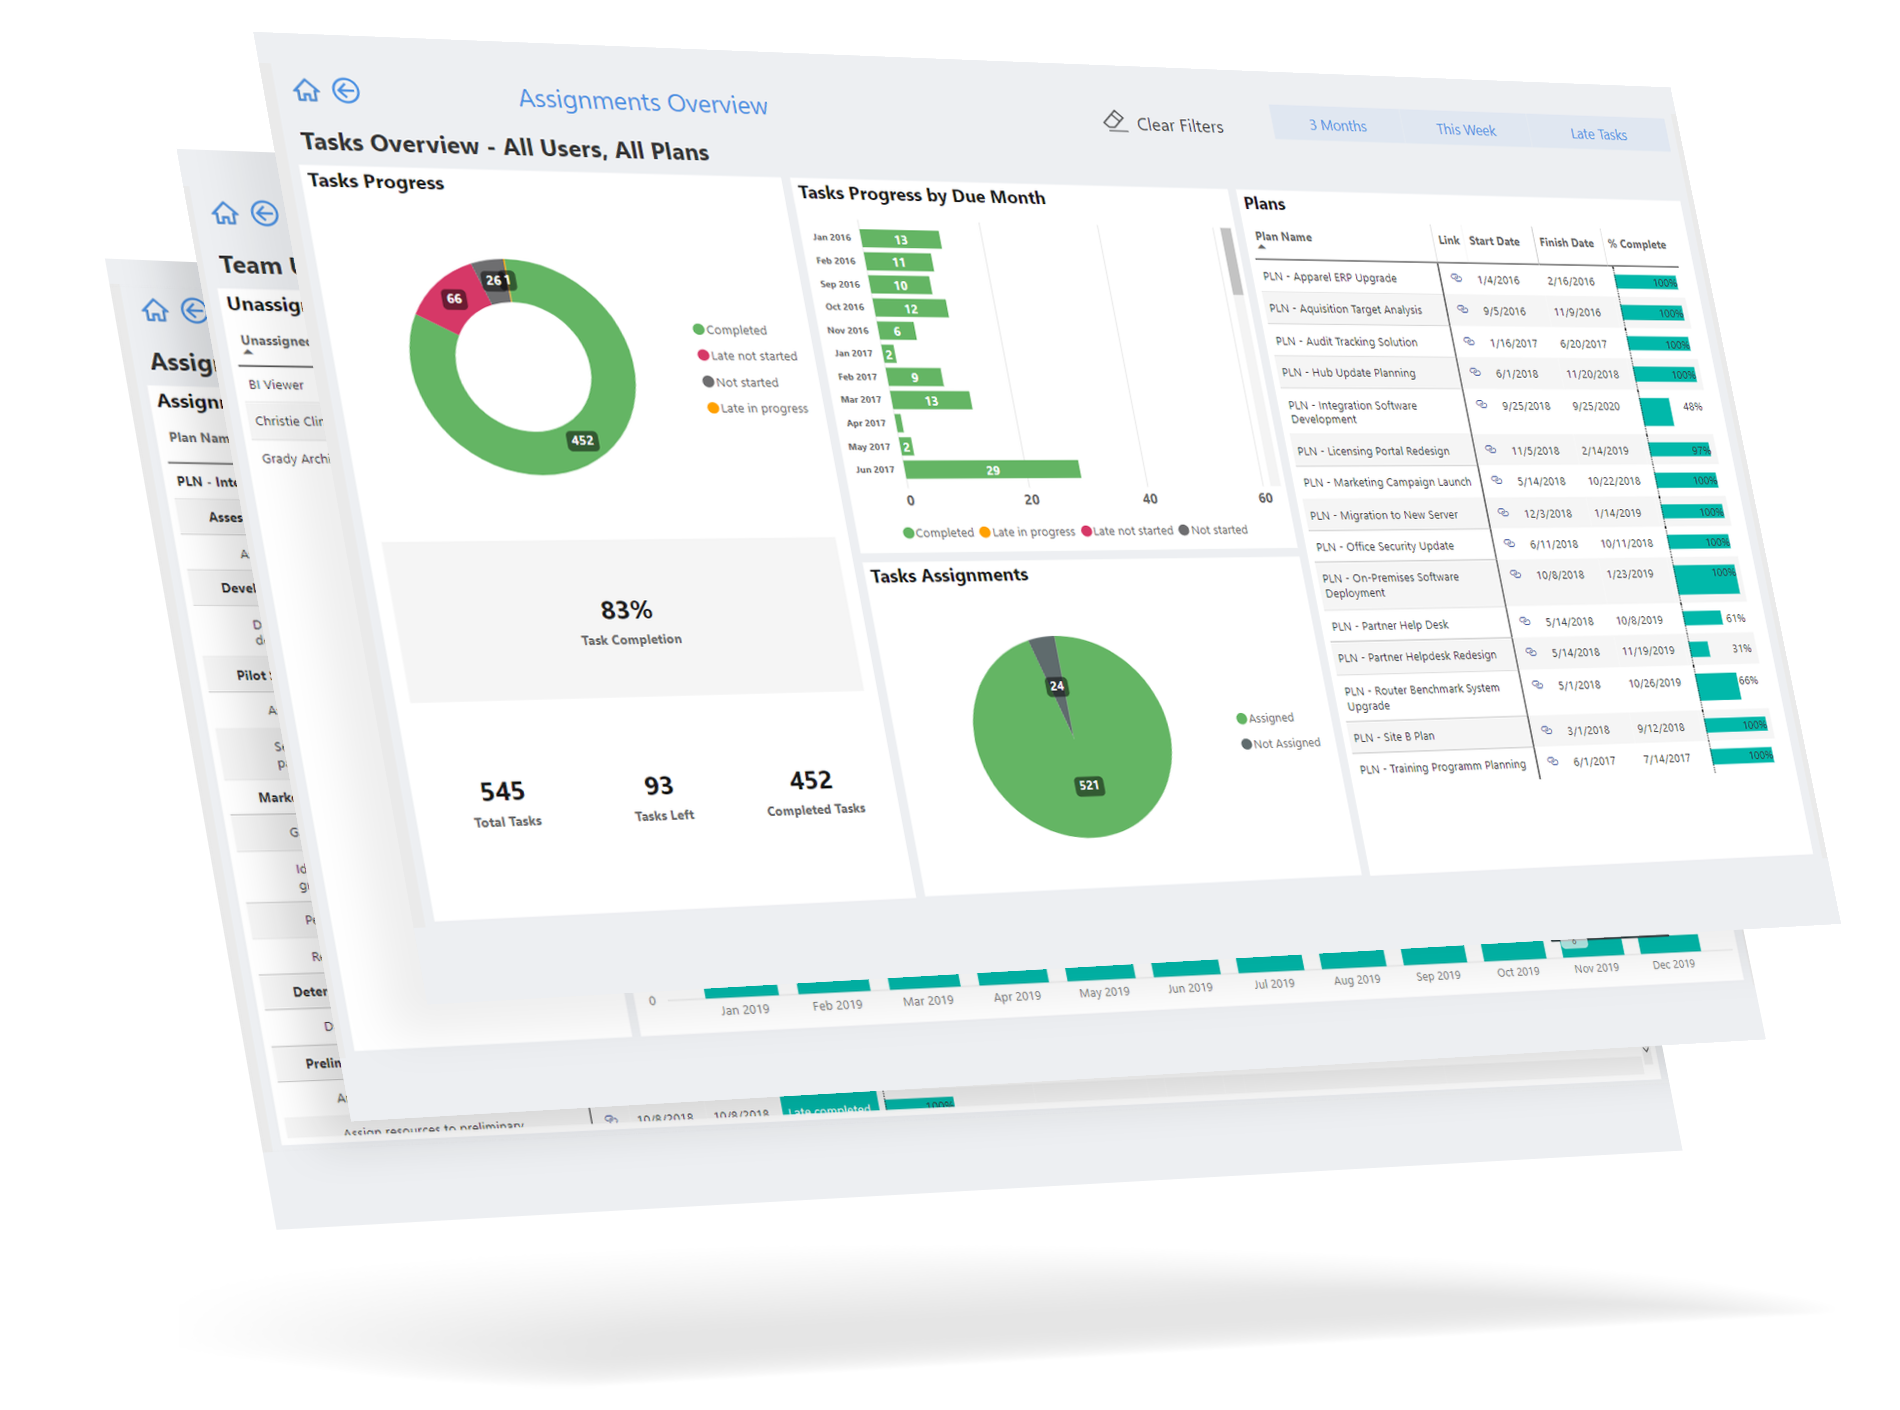
FluentPro Power BI Reports Pack for Office 365
Planner is a ready-made solution for PMOs and
Executives for data visualization, reporting, and analytics.
It includes over 25 pre-built reports and dashboards.
Establish Power BI to Planner connection now
using DataMart as a middleware.