Anna Shalomova
PPM Consultant
Whether your project data is presented using a simple Microsoft Excel book or a collection of cloud and local hybrid data warehouses, Power BI makes it easy for you. It can connect to data sources, identify and visualize important aspects, create project management reporting, and share the results with everyone who needs it. Power BI can work simply and quickly, forming brief analytical information for corporate-level portfolios and project management. This product is suitable not only for large-scale modeling in real-time but also for p-project management of small businesses. Thus, it can act as your visualization and reporting tool and serve as a subsystem of analytics and decision-making for group projects.
Power BI Components
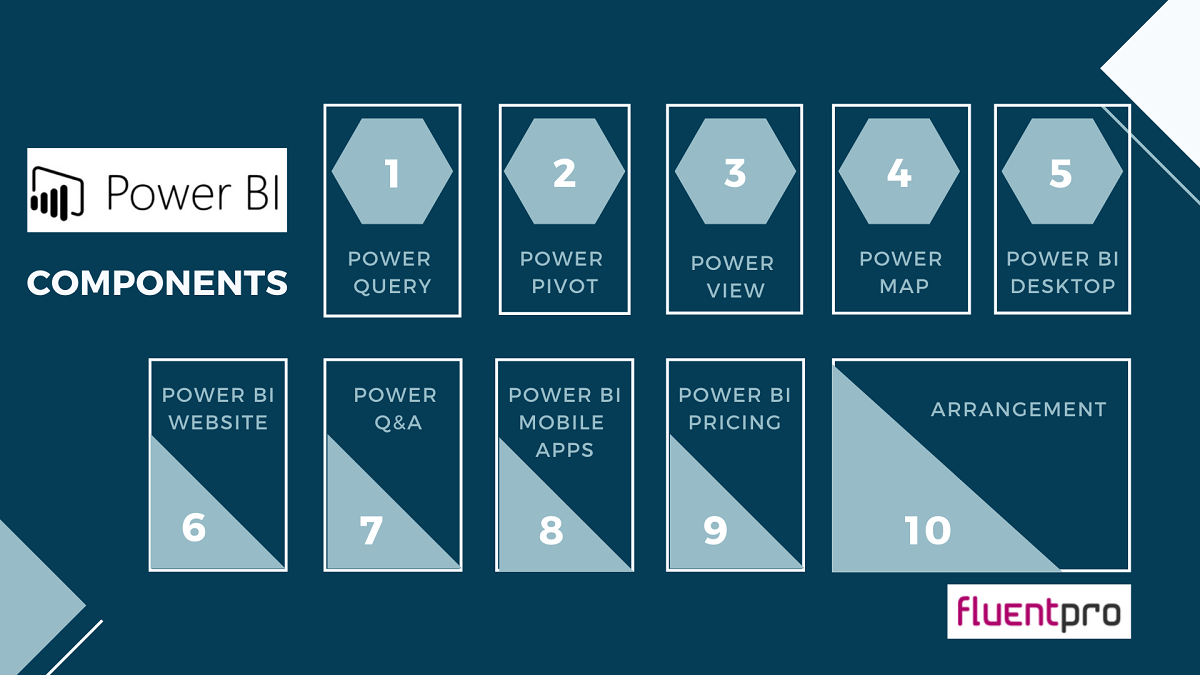
Power BI consists of:
- A classic Microsoft Windows application Power BI Desktop.
- A SaaS web service (software as a service) called the Power BI service.
- Power BI mobile apps are available on Windows smartphones and tablets, as well as on Apple iOS devices and Google Android.
These three elements allow people to create, use, and analyze analytical business information most effectively regarding personal or business tasks.
Interconnecting Power BI with Your Role
The approach to using Power BI may depend on your role in a working group. People in other positions may use Power BI differently, and there is nothing to worry about. For example, you can view reports and dashboards in the Power BI service, which may limit your use of Power BI. Your colleague who processes numeric data and compiles business reports can actively use Power BI Desktop (and publish reports to the Power BI service, which you then view). Another colleague from the sales department can give preference to the Power BI application for the phone, tracking the progress of fulfillment of his sales plan and studying new data on potential customers.
You can also use each Power BI element at different times, depending on your goals and your role in the project or your efforts. For example, you can view inventory and progress information using a real-time dashboard in service. You can also create statistical project management reporting on customer interaction for your team in Power BI Desktop. The approach to using Power BI may depend on which component or Power BI function is optimal in the current situation. At the same time, all the components of Power BI are always available to you, which makes this product so flexible and attractive.
Working with project management, you may encounter Data fragmentation:
- Project data and data on receipt of payments are stored in different systems.
- Reports are prepared manually. Preparation takes a long time; there are no dynamics in the reports.
- Reports cannot be made an urgent request and may contain errors due to human factors.
- To identify the dynamics, you need to compare reports for different periods.
Power BI provides a solution for analyzing the company’s project activity data. It allows you to combine data on projects and financial performance, automate data collection, and create interactive reports.
Power BI Benefits for Small Business Project Management
- Reducing the risks associated with erroneous or late decisions.
- Top management at any time has information on major project management KPIs, even from a mobile phone.
- If necessary, you can go to the dashboard interface and examine the picture in more detail. You can assess the dynamics of projects in the context of internal costs, meeting deadlines, and receipt of payments.
- The project manager sees an online picture of his projects.
Creating a Power BI Report for Project Analysis
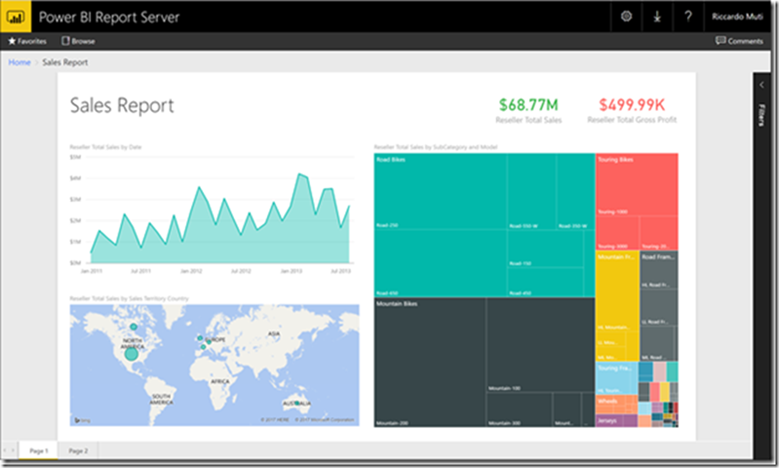
Report editors in Power BI and Power BI Desktop are similar. Usually, you start by creating reports in Power BI Desktop. These reports are then published to the Power BI service, where you can continue to edit them. In Power BI, you can also create dashboards based on reports. You can distribute created dashboards and reports between report users. Depending on what access rights are granted to users, these resources can be used in the Power BI service in reading mode but not editing.
In Power BI, the report editor is available only in edit mode. To open a project management reporting in edit mode, you must be its owner, author, or participant in the application workspace where the report is located. The “Report” section contains five main areas:
- The “Ribbon,” which displays standard tasks, is associated with reports and visualizations.
- Submission Report or Canvas. Here visualization is created and organized.
- The “Pages” tab area at the bottom. Here you can select or add a report page.
- “Visualization panel.” Here you can change visualizations, customize colors or axes
- “Fields panel.” The filtering area is in the Visualization panel.
When you first open the report, three areas are displayed: “Visualization,” “Filters,” and “Fields.” The panels on the left, Visuals and Filters, allow you to customize the appearance of visualizations, including their type, color, filtering, and formatting. Using the Fields panel on the right, you can manage the primary data used in visualizations. The content displayed in the report editor depends on the parameters selected in the report canvas. For example, when selecting a visual element.
Visualizations
If you have not selected a visualization type first and instead started creating a visualization by selecting the fields, the Power BI service will select the visualization type. You can save a Power BI choice or change the type using a different template. Switch between different types as much as you need to find the type of visualization that represents the data in the best possible way.
Managing Visualization Fields
Categories vary depending on the type of visualization selected. For example, if you select a bar chart, you will see containers for values, axes, and legends. When you select a field or drag it to the canvas, Power BI adds this field to one of the containers. You can also drag fields from the Fields list directly into containers. Some containers are only suitable for specific data types. For example, the Values container does not accept non-numeric fields. Thus, if you drag the “customer name” field into the Value container, Power BI changes it to a number. To remove a field from the visualization, click the X button to the right of the field name.
Power BI Packs and Consulting
One more way to ease and minimize the cost of getting all the benefits from Power BI is getting some help and “readymade” Power BI Packs. While Power BI is already a user-friendly solution, a small business might need a specific person to set it up. You don’t have it on your team yet. That’s when you can go for a bit of help setting it up and customize it to suit your specific needs. Our experienced Power BI consultants will help you with more profound data research or customizing your Power BI environment. FluentPro’s Power BI Center of Excellence is just the team of consultants and developers who provide you with all the needed assistance. You can maximize your investment in the Microsoft Power BI platform.
Today’s consulting services aim not to stall until you independently figure out all the quirks. It is here to help you transform organizational data into better business results and more intelligent decision-making. We have extensive experience in Power BI deployment and support that we’ll transfer to your team to create next-generation project management reporting. We can perform complex data modeling and advanced DAX calculations. Power BI reporting can also become more accessible and save time and money with “Readymade reporting packs” for Project Online users. Those will enhance your visibility of Project Online data, create instant dashboards, and adjust reports in seconds.
Schedule a free consultation
to get help with Power BI today