Elena Humeniuk
PPM Consultant
Even in this age of technology, very few people are unaware of the benefits of business intelligence. Every day, newer, more engaging BI technologies emerge, assisting many businesses in solving their issues. For example, when managing projects in Microsoft Project Online, organizations need robust data analytics to watch the progress of the project. Microsoft Power BI is designed to help businesses understand, visualize their data, and create Project Online reporting.
What Is Power BI Report?
Microsoft Power BI report is a multi-perspective view of a dataset with visual representations that illustrate various dataset finds and observations. A report might only have one or more visuals and depict something like a dashboard. But dashboards and Power BI reports serve different functions.
The visuals are highly dynamic and customizable. So, they update as the data structure changes. Moreover, you can add and delete data, alter visualization styles, and apply filters to your model to look for insights and find solutions.
You can produce concise, aesthetically appealing project reports using the Power BI interactive data visualization features in Microsoft Project Online.
Types Of Power BI Reports
Visualizing Microsoft Project Online data, you can use different types of Power BI Reports to cater to different business needs.
- Website analytics report helps analyze websites by deriving information through bounce rate metrics, website conversions, and website visits.
- Financial analysis reports allow for more efficient financial planning and making decisions about profit and losses for the year, monthly expenses, and revenue breakdowns.
- Digital marketing campaigns provide a clear overview of digital marketing related KPIs such as Cost Per Impression (CPM), Cost Per Click (CPC), spending meter, bounce rates, Cost Through Ratios (CTR), advertisement expenses, and conversion rates.
- Sales analysis reports in Power BI help businesses analyze different sales parameters such as trends, market share, competitors, etc.
- Customer profitability reports help enterprises analyze critical business metrics. For example – top 5 selling products, monthly gross margins, number of customers, and monthly revenues.
- HR analytics reports enable you to make strategic plans concerning hiring, attrition, and costs.
How To Build a Report in Power BI
Power BI is only valid if you develop reports on your own. Depending on your job requirements, you may produce reports for your use or to share with coworkers.
There are several methods for building a report for Project Online data. You can begin by creating a simple report using an Excel dataset with the help of the Power BI service.
To create a report, follow these general steps:
- Create connection to the Project Online data. You can also link to multiple data sources.
- Start making your report. After you are done, publish the report to the Power BI website.
Benefits Of Power BI Reports
There are several benefits to integrating Power BI into your business. Here are the most notable ones.
- Project Online Reporting includes complete and real-time data visibility, easy adjustments, and access to correct information anytime. This allows PMOs to make informed business decisions.
- Secure interaction with content. You won’t break the reports while you explore and engage with your material, such as filtering, slicing, subscribing, and exporting.
- You can save your edits even if you can’t break your reports while exploring Power BI reports. You can save your changes, but the changes only affect your view of the data. Moreover, you can click the Reset button to revert the report to its original view whenever necessary.
Challenges with Power BI Reporting
Despite its advantages, Project managers face various challenges when using MS Project Online Power BI Reporting. Let us look at some of the most common ones.
Limited Capability
Businesses often lack equipment and expertise in BI reporting, which makes them skeptical about integrating the tool with their operations. PMOs and executives often lack sufficient reporting capabilities to maximize Power BI’s scope.
Limited Scope
Access to historical data and its reporting can save PMOs time and effort in making appropriate decisions. But historical information is not always readily available. As a result, project managers cannot fully utilize BI reports, hindering their decision-making.
Quality Issues
PMOs often don’t know how to ensure advanced data analytics from Power BI reports. This often leads to slower and improper decision-making for PMOs.
Time Management
Businesses often struggle with reducing the time spent on BI report design. Due to a lack of the right information, reporting may become slower, which can lead to ignorant decision-making by executives.
FluentPro: Power BI for Microsoft Project Online Reporting
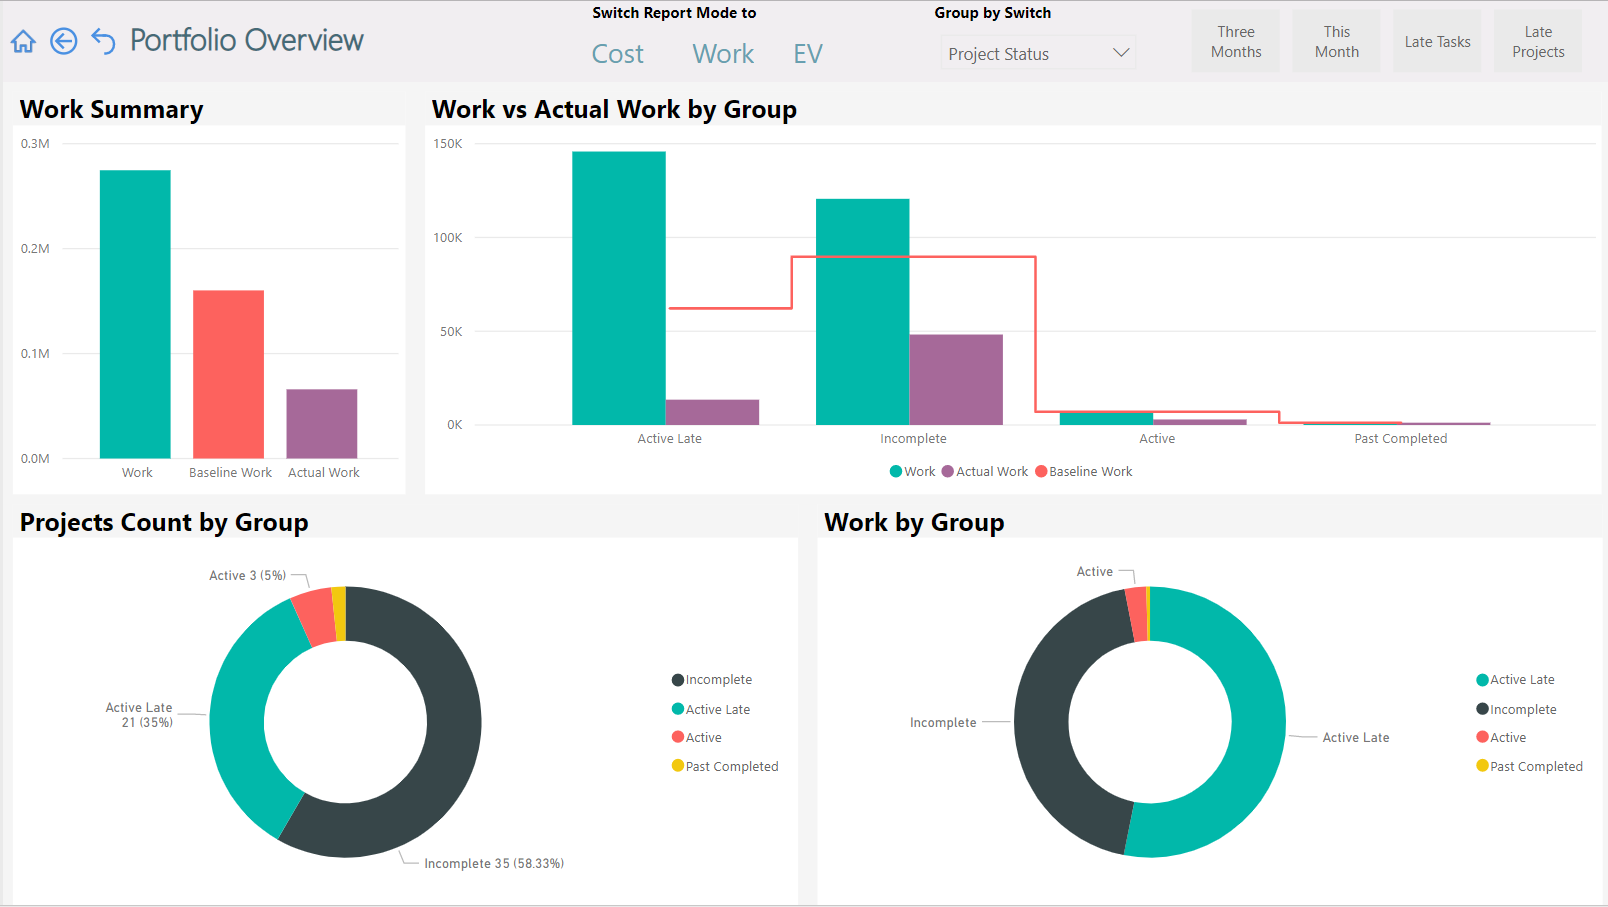
FluentPro Power BI Reports Pack for MS Project Online is a business-growth, data-driven reporting solution. The tool assists PMOs and executives with data visualization, report generation, and analysis. In addition, the solution provides over 25 pre-built reports and dashboards, giving access to historical data.
You can connect Power BI to Project Online using DataMart as a middleware. FluentPro DataMart is a business intelligence tool that offers data visualization to PMOs and executives.
The system extracts data to a SQL Server database without using OData or SSIS packages, allowing you to focus on core tasks while DataMart handles the rest.
FluentPro provides customizable dashboards, complete and real-time data visibility, and fast data updates to make intelligent and informed decisions. Moreover, you can optimize data, adjust historical reports, and centralize SharePoint data.
Conclusion
Business Intelligence has become the norm in recent times, and it is essential to integrate it into daily business operations to stay relevant in the business world. Although it may seem intimidating, you can easily integrate Power BI into your business with FluentPro Power BI reports pack for Project Online.
For 100% reporting and data visualization automation, full data synchronization, 25+ ready-to-use reports on portfolio and resources, and 10+ years of PPM experience, get FluentPro help right away.
Get FluentPro Reports Pack for Project Online