
Anna Shalomova
PPM Consultant
The terms “Power Query,” “Power Pivot,” “Power BI,” and other “Power” more often appear in articles and materials about Microsoft Excel. Not everyone clearly understands what is behind these concepts, how they are interrelated, and how they can help an ordinary Excel user. Let’s clarify the situation.
What is Power Query?
Power Query is an ETL (Extract, Transform, Load) self-service tool that works like an Excel add-in. It allows users to extract data from different sources, manipulate the specified data into a form that matches their needs, and load it into Excel. Back in 2013, a specially created group of developers inside Microsoft released for Excel a free Power Query add-on (other names are Data Explorer, Get, and Transform). It can do a lot of useful things for everyday work:
- Download data to Excel from almost 40 different sources, including databases like SQL, Oracle, Access, Teradata, corporate ERP-systems like SAP, Microsoft Dynamics, Internet services like Facebook, Google Analytics, almost any sites.
- Collect data from files of all basic data types like XLSX, TXT, CSV, JSON, HTML, both singly and in bulk, from all the files in the specified folder. From Excel workbooks, you can automatically download data from all sheets at once.
- Clear the data from the “garbage”. Extra columns or rows, repetitions, service information in the “header,” extra spaces or unprintable characters, etc.
- Putting data in order. Correct case, number-as-text, fill in the blanks, add the correct table header, disassemble the text sticking to the columns and merge back, divide the data into components, etc.
- Transform tables in every way by bringing them into the desired view (filter, sort, change the order of columns, transpose, add totals, expand cross-tables into flat ones, and rollback).
- Substitute data from one table to another by the coincidence of one or several parameters. For example, perfectly replaces the VPR function (VLOOKUP) and its analogs.
Power Query versions
Power Query is available in two versions: as a separate add-in for Excel, which can be downloaded from the official Microsoft website and as part of Excel 2016. In the first case, a separate tab appears in Excel after installation. In Excel 2016, all the Power Query functionality is already built-in by default and is located on the Data tab as a group of Get and Transform.
No matter how you get them, the functions are identical. The principal feature of Power Query is that all actions for importing and transforming data are stored in the form of a query – a sequence of steps in the internal Power Query programming language, which is succinctly called “M.” Steps can always be edited and replayed any number of times (update query).
This is the most useful add-on for a wide range of users among all listed in this article. There are a lot of tasks for which previously you had to either terribly pervert with formulas or write macros – now they are easily and beautifully done in Power Query. Moreover, with the subsequent automatic updating of results. And given the free, in terms of “price-quality” Power Query is simply out of competition and an absolute must-have for any average advanced Excel user these days.
What is Power Pivot?
Power Pivot is an in-memory data modeling component that provides highly compressed data storage and extremely fast aggregation and calculation. It is also available as part of Excel and can be used to create a data model in an Excel workbook. Power Pivot can load data by itself or into Power Query. It is very similar to the SSAS (SQL Server Analysis Services) tabular model, similar to the Power Pivot server version.
Power View is an interactive visualization tool that provides users with a drag-and-drop interface. It allows them to quickly and easily create data visualization in their Excel workbooks (using the Power Pivot data model).
Power Pivot is also an add-in for Microsoft Excel but is intended for other tasks. If Power Query is focused on importing and processing, then Power Pivot is needed mainly for complex analysis of large amounts of data. In the first approximation, you can think of the Power Pivot as pumped pivot tables.
How Power Pivot works
The general principles for working In Power Pivot are as follows:
- First, you load data into Power Pivot — 15 different sources are supported: common databases (SQL, Oracle, Access …), Excel files, text files, data feeds. Besides, you can use Power Query as a data source, which makes analysis almost omnivorous.
- The links are configured between the loaded tables or, as they say, the Data Model is created. This will allow in the future to build reports on any fields from the existing tables as if it was a single table.
- If necessary, additional calculations are added to the Data Model with the help of calculated columns (an analog of a column with formulas in a smart table) and measures (an analog of a calculated field in summary). All this is written in a special internal Power Pivot language called DAX (Data Analysis eXpressions).
The reports of interest to us in the form of pivot tables and charts are built on the Excel sheet of the Data Model. Power Pivot has several features that make it a unique tool for some tasks:
- In Power Pivot, there is no limit on the number of lines (as in Excel). You can load tables of any size and work with them calmly.
- Power Pivot is very good at compressing data when loading it into the Model. A 50 MB source text file can easily turn into 3-5 MB after downloading.
- Since Power Pivot is “under the hood,” in fact, a full-fledged database engine, it copes with large amounts of information very quickly. Need to analyze 10-15 million records and build a consolidated one? And all this on an old laptop? No problem!
Power Maps
This add-on first appeared in 2013 and was originally called GeoFlow. It is intended to visualize geo-data, i.e., the numerical information on geographical maps. The source data for the display is taken from the same Power Pivot Data Model (see the previous paragraph).
The demo version of Power Map (almost no different from the full capabilities) can be downloaded completely free from the Microsoft website. The full version is included in some Microsoft Office 2013-2016 packages with Power Pivot – as a 3D map button on the Insert tab (Insert – 3D-map):
Key features of the Power Map:
- Maps can be both flat and three-dimensional (globe).
- You can use several different types of visualization (histograms, bubble charts, heatmaps, fill areas).
- You can add a time dimension, i.e., animate the process and look at it in development.
Maps are loaded from the Bing Maps service. To view, you need brilliant Internet access. Sometimes there are difficulties with correctly recognizing addresses because names in the data do not always coincide with Bing Maps.
You can use your downloadable maps in the full (not demo) version of Power Map. For example, to visualize visitors to the shopping center or prices for apartments in a residential building directly on the construction plan.
You can create videos directly in the Power Map (example) based on the created geo-visualizations. You can share them later with those who do not have an add-on installed or include PowerPoint in the presentation.
Power View
This add-in appeared for the first time in Excel 2013. It is designed to “revitalize” your data by constructing interactive graphs, charts, maps, and tables. Sometimes it uses the terms dashboard (dashboard) or scorecard (scorecard). The point is that you can insert a special sheet without cells into your Excel file – a Power View slide, where you can add text, pictures, and a lot of different types of visualizations from your data from the Power Pivot Data Model. Here are the nuances:
- The source data is taken from the same place – from the Power Pivot Data Model.
- To work with Power View, you need to install Silverlight on your computer – a Microsoft analog of Flash (free).
- On the Microsoft site, by the way, there is a very decent training course on Power View.
What is Power BI?
Unlike previous ones, Power BI is not an add-in for Excel but a separate product. It represents a whole complex of tools for business analysis and visualization. Power BI is a SaaS service that allows business users to serve their own business intelligence needs. It provides built-in connectivity to SaaS services, such as Salesforce and many others. Power BI carries connections to local and cloud sources using a combination of direct requests and periodic data updates. The solution is available as a freemium service. It is the successor to Power BI for Office 365, based on Microsoft Office 365 and SharePoint Online, and through Excel 2013, it includes Power Query, Power Pivot, and Power View.
Power BI (with O365 and SharePoint Online) provides a website where users can upload and share their created content with other users. They can manage gateways to a corporate data source, including data updates and advanced features such as Q and A, which allows natural language query data models. Microsoft also released the standalone Power BI Desktop application, which links Power Query, Power Pivot, and Power View in a standalone application, eliminating the limitation of Excel 2013. It is also possible to achieve great Power BI functionality using local SQL Server 2012+, Excel 2010+, and SharePoint 2010+ in place if the cloud is not an option for you.
What is Power BI Desktop?
Power BI Desktop is a program for analyzing and visualizing data. It includes, among other things, all the functionality of Power Query and Power Pivot + add-ons and improved visualization mechanisms from Power View and Power Map. Download and install it for free from the Microsoft website. In Power BI Desktop, you can:
- Download data from more than 70 different sources (as in Power Query + additional connectors).
- Link tables to a model (as in Power Pivot).
- Add additional calculations to data using measures and calculated columns on a DAX (as in Power Pivot).
- To create beautiful interactive reports based on data with different visualizations (very similar to Power View, but even better and more Powerful).
- Publish the generated reports on the Power BI Service website (see the next paragraph) and share them with colleagues. And it is possible to give different rights (reading, editing) to different people.
How is Power BI different from Excel?
So Power Query and Power Pivot, in conjunction with Excel can create interactive reports. But there are several crucial differences between Power BI and Excel.
- Power BI allows rich, immersive, and interactive experiences out-of-box. You can click on a bar in a bar chart, and other visuals respond to the event and highlight or filter relevant data. You can show graphs and visuals that are very tricky (or impossible) to reproduce in Excel. These include maps, pictures, and custom visuals.
- Power BI works with large data sets. There is no artificial limit of 1mn row in Power BI. You can hook up to a business data set and analyze any volume of data. The limit depends on what your computer (or Power BI server) can process.
- Share and read reports easily. You can create reports in Power BI and share them in formats that are universal (i.e., browser pages or apps). This means your boss need not have Excel or Power BI installed to enjoy the beautiful reports you create.
Power BI vs Excel
Power BI is for storytelling, while Excel is for almost anything. You can use Excel to simulate pendulum motion, calculate Venus orbit, model a start-up business plan, or many other things. Power BI is mainly for data analysis and storytelling. If you try to replicate a large, intricate financial model or optimization problem with Power BI, you will either fail or suffer miserably. On the other hand, if you use Power BI for making reports and running excellent analysis algorithms (clustering, outlier detection, geospatial patterns, etc.), you will wow your colleagues and bosses.
However, with excellence comes complexity. The more you can do with one tool, the more skill it takes. If you’re starting with Power BI, you can quickly get help by hiring a consultant to show you and your team the proverbial “ropes.” Power BI training services facilitate a smooth transition of the application to your in-house support teams. It gives them the skills to keep improving their reporting capabilities.
How Power BI, Power Query, and Power Pivot are related
Power BI, Power Query, and Power Pivot are related tools in the Microsoft Power Platform for data analysis and visualization. You can use Power Query for data extraction and transformation, Power Pivot for data modeling, and Power BI for data visualization and reporting. Together, these tools provide a comprehensive data analysis and business intelligence solution.
Here is a simple diagram explaining how these Powerful tools are related:
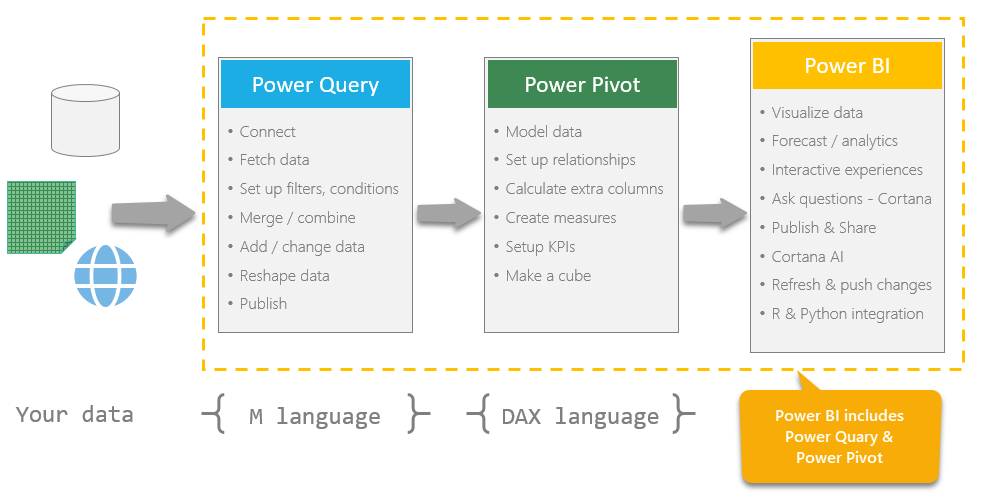
How do these tools work together?
Power Query and Power Pivot complement each other. Power Query is the recommended tool for locating, connecting to, and importing data. In addition, Power Pivot is for powerful data analysis and data modeling. Tools in Excel are very convenient for modeling the data you imported. You can also use it for Excel to view and visualize it using Power Map, Power View, Pivot Tables, and Pivot Charts. Then interact with the resulting workbook in SharePoint, on Power BI sites in Office 365, and in the Power BI application Microsoft Store.
FluentPro Power BI Consulting Services
Our consultants specialize in Microsoft technologies to help your business reap the full benefits of your data. FluentPro’s Power BI Center of Excellence is a professional team of consultants and developers. It will assist in making the most out of your investment in Microsoft Power BI platform. Our Power BI consulting services include:
- BI strategy and business analysis
- Data architecture and integration
- Data modeling, including DAX programming, Power Query ETL implementation, etc.
- Power BI visualization and reports
Our Power BI consulting team has seen a dramatic increase in demand for our services. Mainly from businesses that want to hire our expertise to use new analytical tools. In addition to our core technologies, we can put together an integrated solution to meet all your requirements. Our Power BI consulting service is based on 10+ years of experience. We’ll define your BI strategy, architect and implement all the needed infrastructure, and turn your data into comprehensive insights to empower decision-making. You should consider FluentPro Power BI consulting services to help you with:
- Adoption and implementation of Microsoft BI technologies.
- Customizing the Power BI platform to your maximum benefit.
- Integrating any data sources and maintaining data infrastructure.
- Generate business value through data analytics and visualization.
- Get an individual approach to each client, no matter your enterprise’s size or industry.
- Get advanced customization that is tailor-made for your team and its needs.
- Help with a personal approach to the key people in the organization who want to start with Power BI.
- Work with people who are available from anywhere in the world.
- Have necessary training delivered to the key Power BI business users to learn the skills needed to succeed.
Schedule a free consultation
to get help with Microsoft Power BI and project reporting today