Elena Humeniuk
PPM Consultant
Power BI is a comprehensive suite of software tools, applications, and integration mechanisms that work in unison to transform separate data sources into cohesive, visually engaging, and interactive analytical insights. The data in question could potentially take the form of an Excel spreadsheet, or it may consist of a combination of on-premises hybrid or cloud-based data warehouses. The solution facilitates seamless connectivity with data sources, enables efficient visualization and identification of crucial insights, and facilitates sharing of the same with desired individuals or groups.
Power BI’s Components
The solution has various components that operate uniformly with one another. These fundamental components include:
- Power BI Desktop — a desktop application designed for the Windows operating system.
- The Power BI service— a “software as a service” (SaaS) that is accessible through the internet.
- The Power BI suite — offers mobile applications that are compatible with Windows, Android, and iOS operating systems.
This triad have been specifically designed to enable users to generate, distribute, and consume valuable business insights in a manner that optimally aligns with their individual needs and responsibilities.
In addition to these three components, Power BI overview also includes two other components, namely:
- The Microsoft Report Builder— used for generating paginated reports that project managers can share through the Service. Continue reading this article for further information regarding paginated reports.
- The Microsoft Report Server – an on-premises platform that enables project managers to publish their reports created in Desktop.
How Power BI Aligns with your Roles
The best answer to the question, “How does Power BI work?” is to consider how it fits your needs. The way you decide to use it will largely depend on your responsibilities either as a project manager or as another project team member.
For instance, some project managers use it to view dashboards and data visualization. A colleague who engages in quantitative analysis and generates corporate documents may heavily rely on Power BI Desktop or Report Builder for the creation and publications reports and view them on the Service. An employee who works in the sales department may use the mobile application to track how much progress is being made on sales targets and get details on new sales leads.
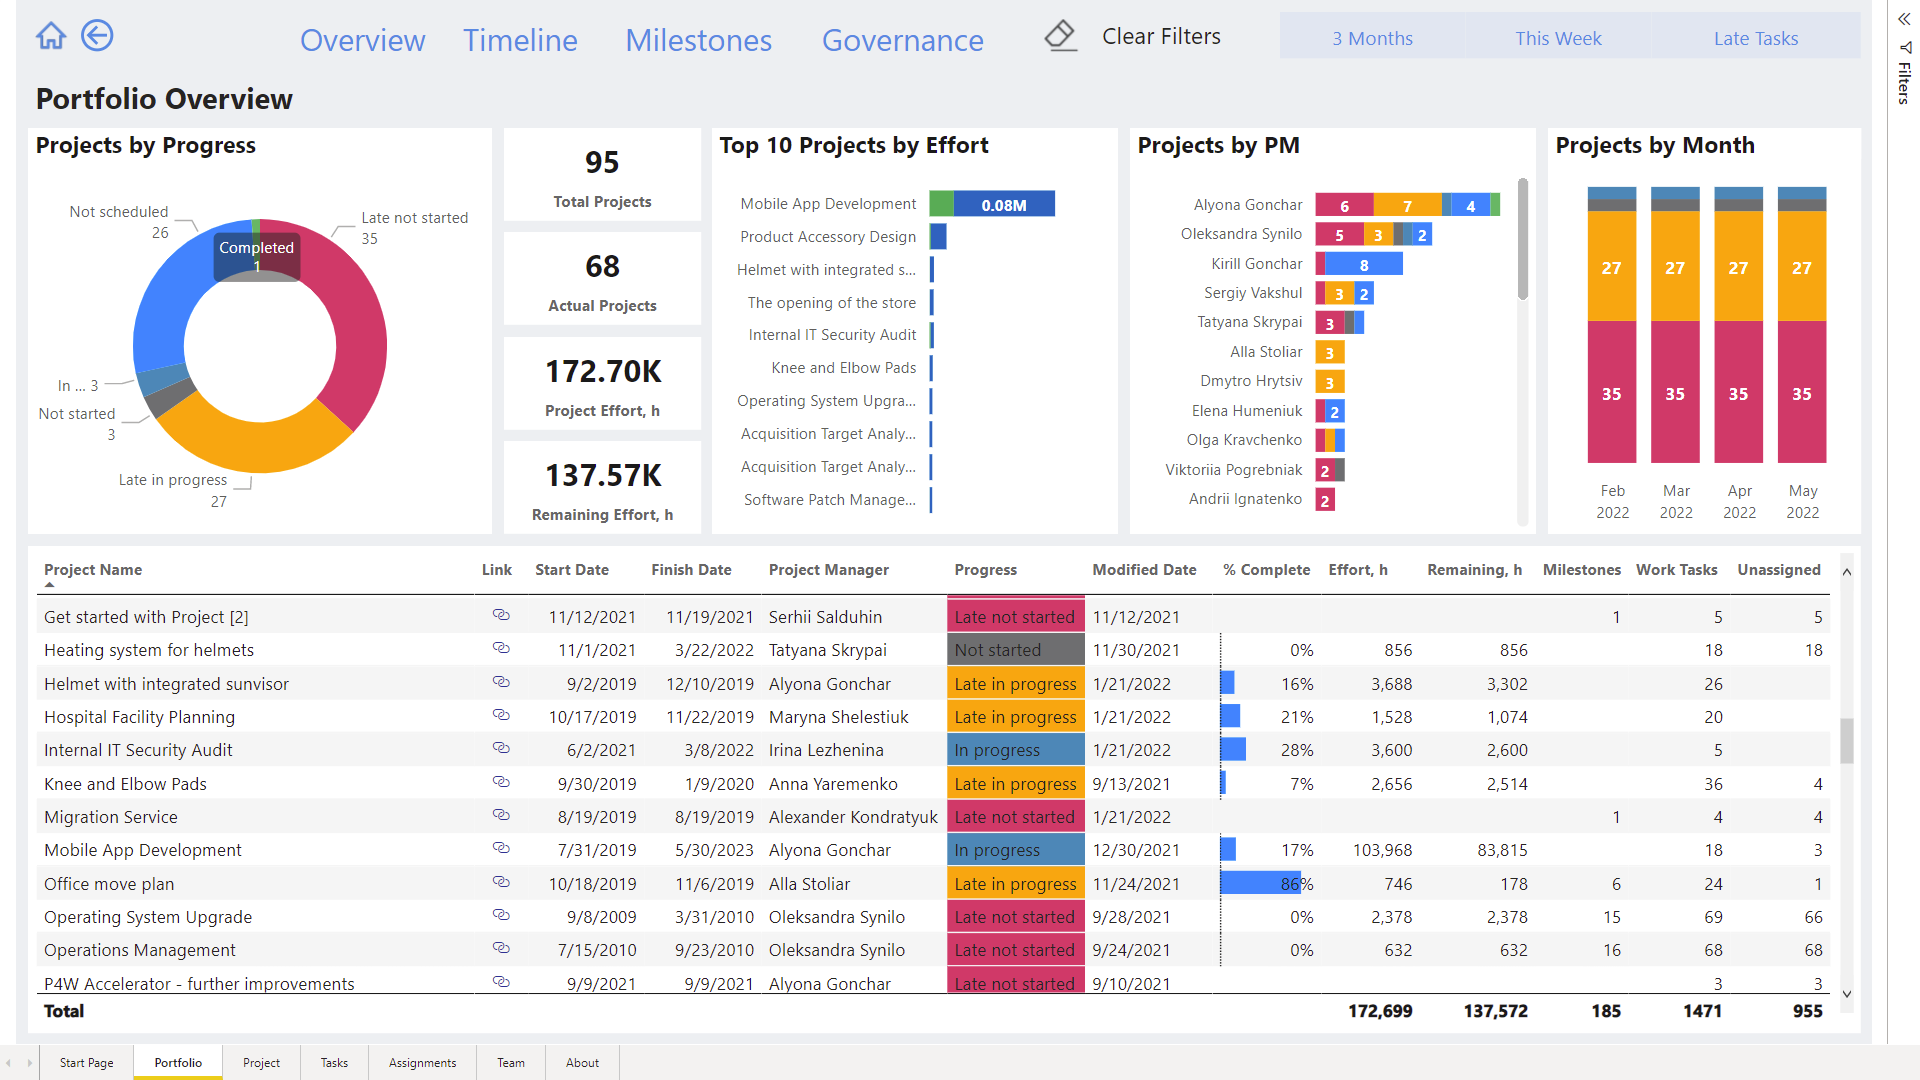
Developers may utilize APIs to integrate data into datasets or to incorporate dashboards and reports into their personalized applications. Do you have a concept for a new visual representation? Construct it personally and share it among your peers
What is Power BI Used For?
The utilization of individual components may vary depending on the objectives or assigned responsibilities for a particular project. Here are various uses:
- You can use each component of the Power BI Microsoft at different time frames, depending on your role or what you’re striving to achieve in a particular project.
- You can employ Power BI Desktop to generate reports pertaining to customer engagement statistics for internal teams while leveraging the dashboard to monitor inventory and manufacturing progress in real-time.
- It can also be used for creating paginated reports that contain invoices that can be mailed, using a unique dataset.
All components and functionality are available for your deployment at any time, thanks to their flexibility and reliability.
The Workflow in Power BI
Workflows start by linking to different data sources in Microsoft Power BI Desktop and then creating a report. Subsequently, the report is shared to the service, where it is made accessible to business users on both the service and mobile devices. This enables them to view and engage with the report.
This is a commonly used type of workflow that effectively demonstrates the synergistic relationship between the three primary components of the software.
Take Advantage of the Deployment Pipeline Tool
Deployment pipeline tool enables users to conduct content testing prior to its release to end-users. Using the deployment pipeline tool can help you to quickly facilitate the deployment of various types of reports, including dashboards, paginated reports, datasets, and other relevant materials.
Paginated Reports in the Power BI Service
Another workflow describes how paginated reports are used within the Service. They are designed by enterprise creators with the intention of being printed or shared. These reports can be shared on the service as well. The term “paginated” is used to describe the formatting of a document in a manner that optimizes its presentation on a single page. Most times, they are utilized for generating operational reports or producing printed documents like invoices or transcripts. The data is presented in a tabular format, with continuity maintained across multiple pages. The Report Builder is a self-contained software application designed for the purpose of creating paginated reports.
Using Power BI Report Server for On-premises Reporting
Power BI Report Server offers a suite of tools and services that enable users to generate, implement, and oversee visualizations in Desktop, as well as paginated reports in Report Builder.
The Microsoft Report Server is a software solution that can be installed within an organization’s network perimeter, enabling the dissemination of reports to designated recipients through various channels such as web browsers, mobile devices, and email. The compatibility between Report Server and Power BI in the cloud enables a seamless transition to the cloud at the user’s discretion.
Get Excellent Results with FluentPro Power BI Consulting Service
Get things up and running in no time with FluentPro Power BI Consulting Service. FluentPro is a leading tech company with more than 10 years or experience in adoption and customization. Our consulting team has helped hundreds of organizations worldwide to transform data in order to achieve better decision making and excellent business results. We help define your strategy, architecture, and implement all necessary infrastructure. At the end, you’d get a resounding, flexible dashboard with result-oriented data.
Schedule a free consultation
to get help with Power BI reports


